Customer Spending Prediction
Regression • Linear model + behavioral insights for e-commerce spending

Predict yearly customer spending from behavioral metrics collected from an e-commerce platform. Using linear regression, this project analyzes how time on app, time on website, average session length, and membership duration influence spending.
TL;DR
Linear regression model to predict yearly amount spent and interpret which behavioral metrics drive purchases.
My role
Built the workflow: EDA → train/test split → linear regression → evaluation with residual analysis and interpretation.
Tech
Links
Overview
This project examines key factors that impact spending. A consistent takeaway from the analysis is that Length of Membership is one of the strongest predictors, and Time on App tends to correlate more strongly with spending than Time on Website.
Workflow
- Data collection: Load the dataset (
Ecommerce Customers.csv) and inspect columns/types. - EDA: Joint plots, pair plots, and regression plots to understand feature relationships.
- Model training: 70/30 split; train Linear Regression on the four main features.
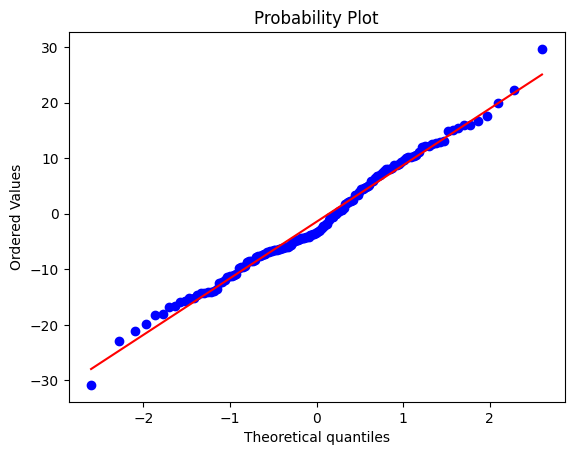
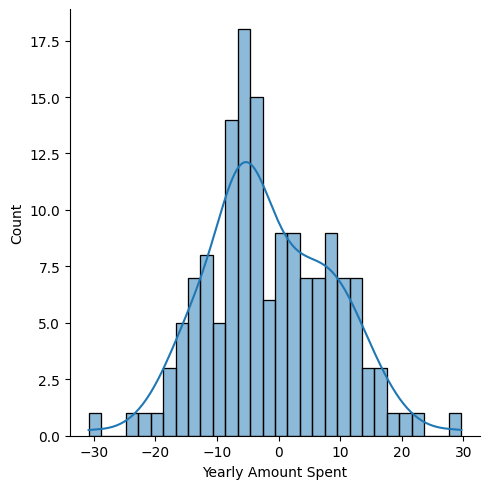
- Evaluation: Scatter plot of predictions vs actual + residual analysis (distribution sanity check).
Media
Repository
Explore the code on GitHub: Customer Spending Prediction